Le Spectrographe


|
Le Spectrographe |
|
|
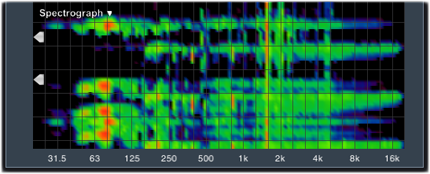
Introduction au Concept de Mesure > Le Spectrographe Spectrograph display in Smaart 7 as a way of looking at the spectral content of the signal over time. It is similar in concept to the RTA display except that instead of each moment in the life of the signal appearing on the screen only for an instant, then immediately replaced by another, a spectrograph stacks them up to show you a history. On the spectrograph display, each horizontal slice of the graph represents what would be one update to an RTA display, with the amplitude for each frequency represented by color, rather than by its vertical position on the graph.
There are any number of applications where this capability can come in handy. The live Spectrograph has been one of the most popular features in Smaart almost since its introduction and the spectrograph in Smaart 7 represents a significant Improvement over how this feature worked in previous versions. One of the most common is feedback hunting, where the spectrograph excels because any persistent tone shows up as a vertical streak on the plot. This makes it much easier to see feedback starting to build than on RTA display where it often must reach a much higher level before becoming clearly obvious enough to stand out. Another popular application for the spectrograph is the "poor man's polar plot" where an operator runs the spectrograph while walking around the loudspeaker in a circle to evaluate its coverage pattern.
In previous versions of Smaart, the amount of history that the spectrograph could show you was basically what could fit on the screen at one time, so if a transient event scrolled off the screen before you could pause the display or locate its frequency, it was gone forever. In Smaart 7, spectrograph display is built from an internal model that can keep as much as a minute's worth of data in the history, enabling you to scroll the display back to see things you might've missed otherwise.
Another useful new feature in the Smaart 7 spectrograph is the ability to change the dynamic range of the graph on-the-fly. In previous versions of Smaart each measurement was converted to a stripe on the graph as it scrolled by and that was that. No other history was kept except the bitmap displayed on the screen and changes in display parameters could be applied only to new data that came the change was made. But since Smaart 7 is building the spectrograph in memory before displaying it, changes can now be applied to the model in memory and then used to update the entire display. So not only can you scroll back to see something you would have missed before, you can also tweak the dynamic range of the graph to make it easier to see.
The upper and lower limits of the spectrograph dynamic range can be set by dragging the two handles that appear on the left edge of both the spectrograph and RTA displays. Or if you prefer to set the range numerically, you can still do that from the Spectrum options page in the main Options dialog. Other parameters for the spectrograph are available in spectrum options as well, such as controls for the FFT size and overlap, the amount of history you want to keep (please note that a long spectrograph history can require rather a lot of memory), and whether to display the spectrograph in color or grayscale. |